SQL Server CE: Multiple single-column statistics
- Get link
- X
- Other Apps
I’m going to start a series of posts talking about SQL Server CE(Legacy/New).
The way that SQL Server calculates the estimated row of one single predicate is straightforward and simple.
Well, it becomes a little bit complex when SQL Server handles more than one predicates.
Unlike the one single predicate, SQL Server has different strategies for Legacy CE and New CE.
In Legacy CE, SQL Server assumes that data distribution on different columns are independent;
In New CE, SQL Server assumes that data distribution on different columns are correlated.
For short, the estimated rows returned by New CE is generally greater than the rows returned by Legacy CE.
Here are examples , adventure 2019 OLTP database is used in this example
------- Data prepare-------------------------------------------
alter database [AdventureWorks2019] set compatibility_level=150
go
use [AdventureWorks2019]
go
if exists(select 1 from sys.tables where name='SalesOrderDetail')
drop table SalesOrderDetail
go
select * into SalesOrderDetail from Sales.SalesOrderDetail---- import all the data into new table SalesOrderDetail.
go
------- Data prepare-------------------------------------------
----- I'll use following T-SQL query, which return 533 rows, to demonstrate
select * from SalesOrderDetail where ProductID=711 and UnitPrice=20.1865
Legacy CE
1.use trace 9481 to make sure old CE is used
select * from SalesOrderDetail where ProductID=711 and UnitPrice=20.1865 option(querytraceon 9481,recompile)--force old CE
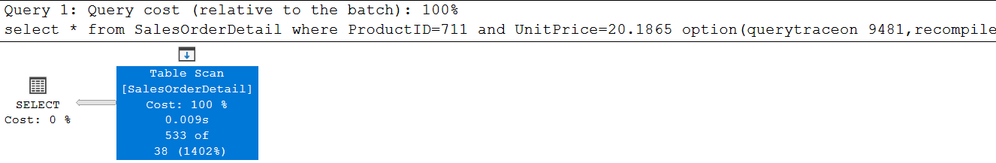
2.The estimated rows is 38, while the actual returned rows is 533. Let's dive into to see how the estimated row 38 calculated. Please note, if your estimated row is different from mine, please update the stats with fullscan.
update statistics SalesOrderDetail with fullscan.
3.Show the statistics
select *From sys.stats where object_id=object_id('SalesOrderDetail')
As where clause has two different columns, two different columns are created automatically

4.The two predicates are connected by AND, with selectivity P0 and P1. The combined selectivity is:P0*P1. Let's dive into
1)Estimated row: P0*P1*Card.
P0 is the selectivity of first column, P1 is the selectivity of second column. The order does not mater.
Card is the total number of rows ,which is 121317 in this case.
there are two columns in where clause: ProductID and UnitPrice
2)Selectivity of ProductID(P0): 0.02547046
ProductId:711
Estimation rows:3090
Selectivity: 3090/121317=0.02547046
dbcc show_statistics(SalesOrderDetail,_WA_Sys_00000005_0E8E2250)

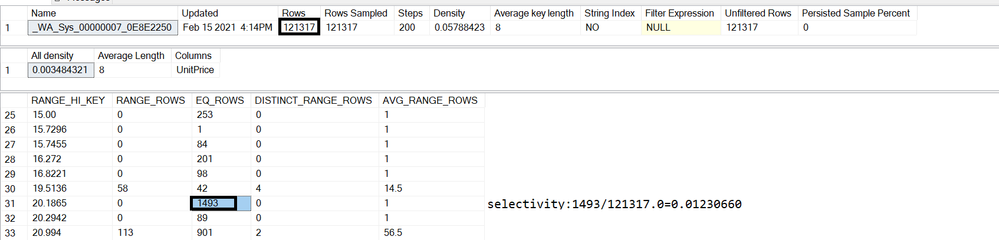
3)Selectivity of UnitPrice: 0.01230660
UnitPrice:20.1865
Estimation rows:1493
Selectivity :1493/121317=0.01230660
dbcc show_statistics(SalesOrderDetail,_WA_Sys_00000007_0E8E2250)
4)Total estimation:P0*P1*'table cardinality' =0.02547046*0.01230660*121317=38.0273914872384120, is rounded down to 38.
5.If there are more than two predicates, just multiples the predicate:P0*P1*P1….*PN.
New CE
1.The formula of combined selectivity in New CE is totally different:: P0 *P1^(1/2) *P2^(1/4) *P3^(1/8)
2.P0,P1,P2,P3 are the selectivity of each predicate where P0<P1<P2<P3.
3.If there are more than 4 columns in the where clause, only the first 4 are counted, the rest of them are ignored.
In practice, Please use following formula instead if there are more than 2 predicate.
select EXP( log(@p0)+0.5*log(@p1)+0.25*log(@p2)+0.125*log(@p3) )
1.Run follow querying in New CE, which is the default setting for compatibility level 150
select * from SalesOrderDetail where ProductID=711 and UnitPrice=20.1865
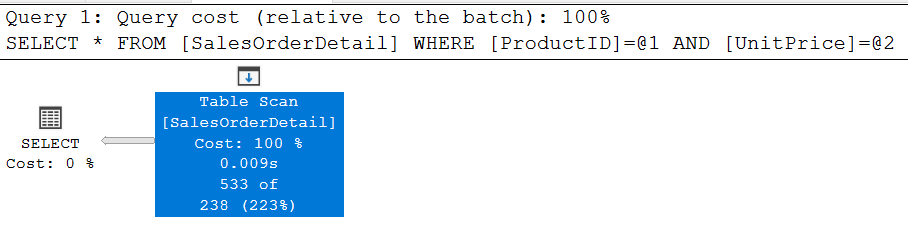
2.The estimated rows is 238, much closer than OLD CE value 38. Let's dive into to see how the estimated row 238 calculated.
3.Let's see how it's calculated.
1)In this case, we have two predicates, so the combined predicate is P0*P1^(1/2)
2)Selectivity of ProductID: 0.02547046
ProductId:711
Estimation rows:3090
Selectivity: 3090/121317=0.02547046
dbcc show_statistics(SalesOrderDetail,_WA_Sys_00000005_0E8E2250)

3)Selectivity of UnitPrice: 0.01230660
UnitPrice:20.1865
Estimation rows:1493
Selectivity :1493/121317=0.01230660
dbcc show_statistics(SalesOrderDetail,_WA_Sys_00000007_0E8E2250)

4)Because selectivity of UnitPrice( 0.0125629219) is less than selectivity of ProductID(0.02547046)
P0=0.01230660
P1=0.02547046
Combined selectivity :P0*P1^(1/2)=0.01230660*sqrt(0.02547046)=0.00196406781623722
Total estimated row is:
P0*P1^(1/2)*Card =0.00196406781623722*121317=238.274815262451,is rounded down to 238.
Assessment:
----T-SQL
use AdventureWorks2019
go
IF exists(select 1 from sys.tables where name='Product' and schema_id=schema_id('dbo'))
drop table Product
go
IF exists(select 1 from sys.tables where name='SalesOrderDetail' and schema_id=schema_id('dbo'))
drop table SalesOrderDetail
go
select * into SalesOrderDetail from Sales.SalesOrderDetail
GO
--create five statistics
create statistics I_ProductID on SalesOrderDetail(ProductID) with fullscan
create statistics I_orderqty on SalesOrderDetail(orderqty) with fullscan
create statistics I_SpecialOfferid on SalesOrderDetail(SpecialOfferid) with fullscan
create statistics I_modifiedDate on SalesOrderDetail(modifiedDate) with fullscan
create statistics I_unitpricediscount on SalesOrderDetail(unitpricediscount) with fullscan
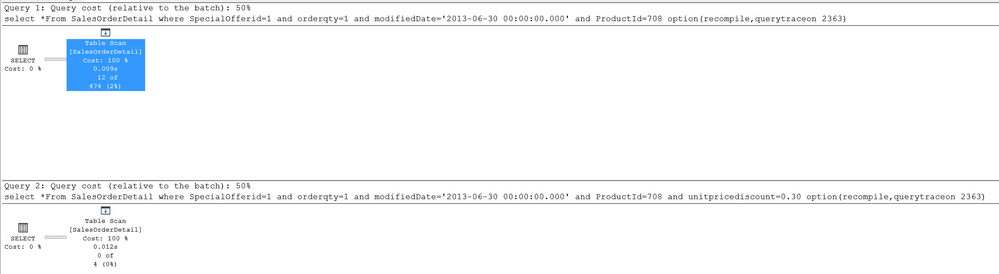
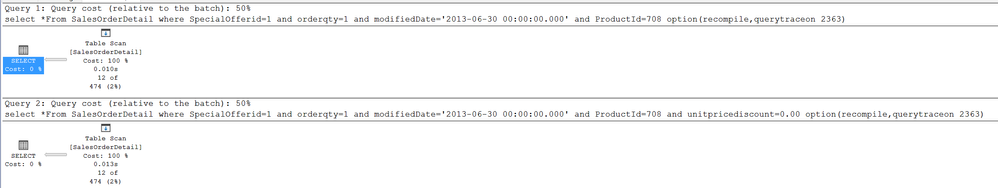
1.A DBA is doing some tests, he finds that the estimated rows is reduced when he puts more columns in the where clause. For example, the estimated row of following query is 474
select *From SalesOrderDetail where SpecialOfferid=1 and orderqty=1 and modifiedDate='2013-06-30 00:00:00.000' and ProductId=708 option(recompile,querytraceon 2363)
The estimated row is reduced to 4 after he put another column in the where clause: unitpricediscount=0.30
As tests continues, the customers finds that it's not always true. After he replaces the unitpricediscount=0.30 with unitpricediscount=0.00, the estimated row is still 474, not decreased. Why ?
2.Please test the same query using Legacy CE, do you get the same result?


Comments
Post a Comment