SQL Server CE: Multi-columns statistics
In post SQL Server CE: Multiple single-column statistics, I discussed how SQL Server calculates Multiple single-column statistics. I'm going to talk about the 'multiple-columns statistics' today.
Here are examples , adventure 2019 OLTP database is used in this example
------- Data manipulation-------------------------------------------
alter database [AdventureWorks2019] set compatibility_level=150
go
use [AdventureWorks2019]
go
if exists(select 1 from sys.tables where name='SalesOrderDetail')
drop table SalesOrderDetail
go
select * into SalesOrderDetail from Sales.SalesOrderDetail---- import all the data into new table SalesOrderDetail.
Go
--Create two statistics explicitly. The first statistics has two columns
create statistics I_ProductID_UnitPrice on SalesOrderDetail(ProductID,UnitPrice) with fullscan
create statistics I_UnitPrice on SalesOrderDetail(UnitPrice) with fullscan
------- Data manipulation-------------------------------------------
NEW CE in different database compatibility behaves differently, I'm going to demo by one by.
NEW CE-2017/2019-db_compatibility_level>=140
a)The selectivity of combined multi single-column stats, the formula is: MAX( min('all density',p0,p1,p2,p3), p0*p1*p2*p3)
b)'All density' of the combined columns in multi-column statistics
c)p0,p1,p2,p3 are the selectivity of each value of the column in WHERE clause and P0<p1<p2<p3.
d)If the multi-columns has more than 4 columns, it only counts the first 4, the rest of them are ignored.
1.New CE with compatibility_level 150
alter database [AdventureWorks2019] set compatibility_level=150
select * from SalesOrderDetail where ProductID=870 and UnitPrice=4.99 option(recompile)
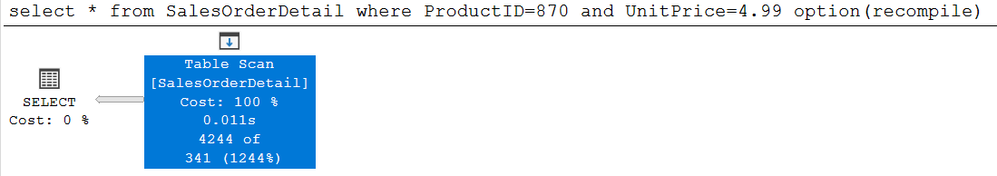
1)The estimated row is 341.
2)Here is the estimated row formula: max( min('All density of two columns',P1,P2),P1*P2) *cardinality.
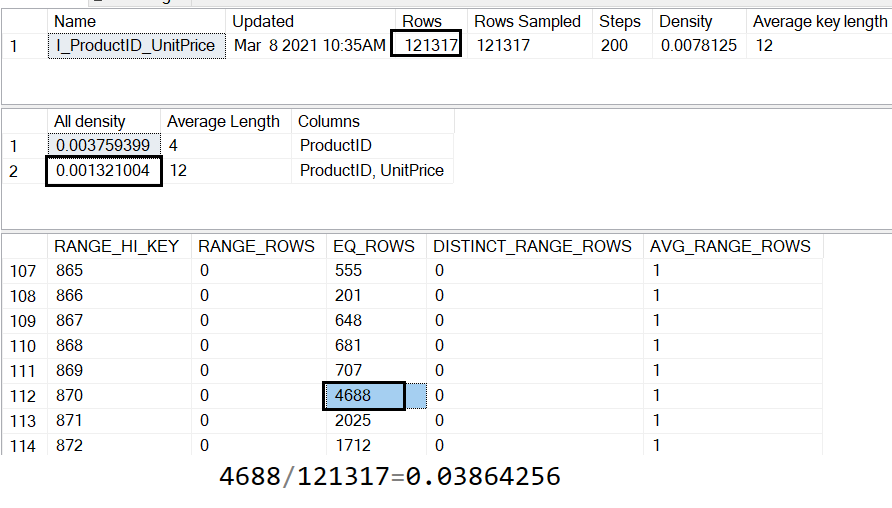
a)All density of two columns is :0.001321004
b)p0 is the selectivity of statistics of one column(ProductID) in where clause, which is 4688/121317=0.03864256
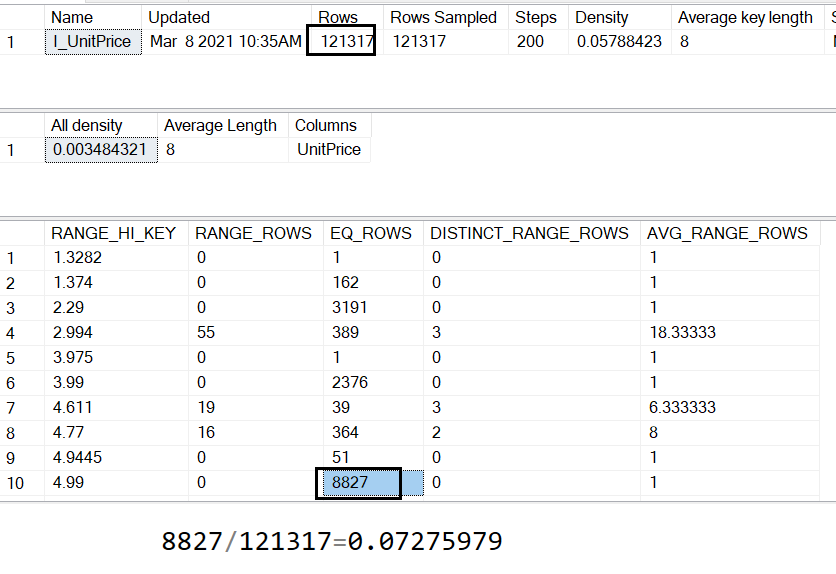
c)p1 is the selectivity of statistics of the rest of column(UnitPrice), which is 8827/121317=0.07275979
d)cardinality is 121317
dbcc show_statistics(SalesOrderDetail,I_ProductID_UnitPrice)

dbcc show_statistics(SalesOrderDetail,I_UnitPrice)
3)Let me pass the values to the formula: max( min('All density of two columns',p0,p1),p0*p1) *cardinality
max( min(0.001321004,0.03864256,0.07275979),0.03864256*0.07275979)*121317
=max(0.001321004,0.03864256*0.07275979)*121317
=max(0.001321004,0.0028116245506624)*121317
=0.0028116245506624*121317=341.09785561, rounded down to 341.
4)Enable trace flag 2363 gives you more detail
Dbcc traceon(3604,2363)
------------trace flag 2363 output-----------------
Loaded histogram for column QCOL: [AdventureWorks2019].[dbo].[SalesOrderDetail].ProductID from stats with id 2
Loaded histogram for column QCOL: [AdventureWorks2019].[dbo].[SalesOrderDetail].UnitPrice from stats with id 3
Cardinality using multi-column statistics 0.001321 and with independence assumption 0.00281163. Picking cardinality 0.00281163
Selectivity: 0.00281163
Stats collection generated:
CStCollFilter(ID=3, CARD=341.098)
CStCollBaseTable(ID=1, CARD=121317 TBL: SalesOrderDetail)
End selectivity computation
------------trace flag 2363 output-----------------
NEW CE-2016-db_compatibility_level=130
a)The selectivity of multi single-column stats, the formula is: min('all density',p0,p1,p2,p3)
b)'All density' is the one for all columns in multi-column statistics
c)p0,p1,p2,p3 are the selectivity of each value of the column in WHERE clause and P0<p1<p2<p3.
d)If the multi-columns has more than 4 columns, it only counts the first 4, the rest of them are ignored.
Note, if trace flag 4199 is enabled, this rule is as same as the rule in DB_compatibility_level 140/150
1.New CE with compatibility_level 130
alter database [AdventureWorks2019] set compatibility_level=130
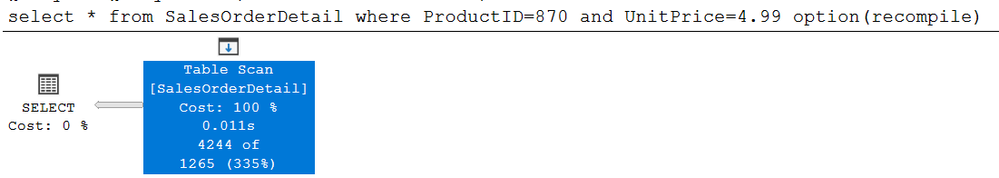
select * from SalesOrderDetail where ProductID=870 and UnitPrice=4.99 option(recompile)

1)The estimated row is 160.
2)Here is the estimated row formula: min('all density',p0,p1,p2,p3) *cardinality.
a)All density of two columns is :0.001321004
b)p0 is the selectivity of statistics of one column(ProductID) in where clause, which is 4688/121317=0.03864256
c)p1 is the selectivity of statistics of the rest of column(UnitPrice), which is 8827/121317=0.07275979
d)cardinality is 121317
dbcc show_statistics(SalesOrderDetail,I_ProductID_UnitPrice)

dbcc show_statistics(SalesOrderDetail,I_UnitPrice)

3)Let me pass the values to the formula: min('All density of two columns',p0,p1) *cardinality
MIN(0.001321004,0.03864256,0.07275979)*121317=0.001321004*121317=160.260242268, is rounded down to 160.
4)Enable trace flag 2363 gives you more detail
Dbcc traceon(3604,2363,)
------------trace flag 2363 output-----------------
Loaded histogram for column QCOL: [AdventureWorks2019].[dbo].[SalesOrderDetail].ProductID from stats with id 2
Loaded histogram for column QCOL: [AdventureWorks2019].[dbo].[SalesOrderDetail].UnitPrice from stats with id 3
Selectivity: 0.001321
Stats collection generated:
CStCollFilter(ID=3, CARD=160.26)
CStCollBaseTable(ID=1, CARD=121317 TBL: SalesOrderDetail)
End selectivity computation
------------trace flag 2363 output-----------------
NEW CE-2014-db_compatibility_level=120
SQL 2014 is not aware of Multi-columns stats, the algorithm is as same as Multiple single column statistics.formula is: p0 * p1^(1/2) * p2^(1/4)* p3^(1/8)
Note, if trace flag 4199 is enabled, this rule is as same as the rule in DB_compatibility_level 140/150
1.New CE with compatibility_level 120
alter database [AdventureWorks2019] set compatibility_level=120
select * from SalesOrderDetail where ProductID=870 and UnitPrice=4.99 option(recompile)
1)The estimated row is 12650.
2)Here is the estimated row formula: p0 * p1^(1/2) *cardinality.
a)All density of two columns is :0.001321004
b)p0 is the selectivity of statistics of one column(ProductID) in where clause, which is 4688/121317=0.03864256
c)p1 is the selectivity of statistics of the rest of column(UnitPrice), which is 8827/121317=0.07275979
d)cardinality is 121317
dbcc show_statistics(SalesOrderDetail,I_ProductID_UnitPrice)
dbcc show_statistics(SalesOrderDetail,I_UnitPrice)

3)Let me pass the values to the formula: p0 * p1^(1/2) *cardinality
0.03864256*0.07275979^(1/2)*121317=0.0104235*121317=1264.547750, is rounded up to 1265.
4)Enable trace flag 2363 gives you more detail
Dbcc traceon(3604,2363,)
------------trace flag 2363 output-----------------
Loaded histogram for column QCOL: [AdventureWorks2019].[dbo].[SalesOrderDetail].ProductID from stats with id 2
Loaded histogram for column QCOL: [AdventureWorks2019].[dbo].[SalesOrderDetail].UnitPrice from stats with id 3
Selectivity: 0.0104235
Stats collection generated:
CStCollFilter(ID=2, CARD=1264.54)
CStCollBaseTable(ID=1, CARD=121317 TBL: SalesOrderDetail)
End selectivity computation
------------trace flag 2363 output-----------------

SQL Server CE: Multiple single-column statistics (sqlserverbang.blogspot.com)
SQL Server CE: Multiple single-column statistics connected by OR (sqlserverbang.blogspot.com)
SQL Server CE: Multiple single-column statistics (sqlserverbang.blogspot.com)
SQL Server CE: Multi-column statistics (sqlserverbang.blogspot.com)


Comments
Post a Comment